AI Surrogate Model
The AI Surrogate Model is a tool that allows one to interpolate a set of data through the previously generated models. This interpolation is only available for the methods that are building a model: Uncertainty Quantification, Data Analysis and Statistical Optimization.
This tool needs as an input, the interpolant file generated in the
Core Solver (.upsi), and a .txt
file with the samples to be computed in a .csv format, with as many columns as the number of variables
and rows as number of samples to be interpolated.
How to use the interface
The initial state of the application’s window can be seen in Figure 1. The screen is divided into two
parts. In the left part, is selected the .upsi interpolant file to be used). This file has all the
information required regarding the model. All the interpolant files that are inside the project folder
appear directly on the screen and can be directly selected by clicking on them. Nevertheless, it is possible
to select any file with the Browse button that will open a File Browser window.
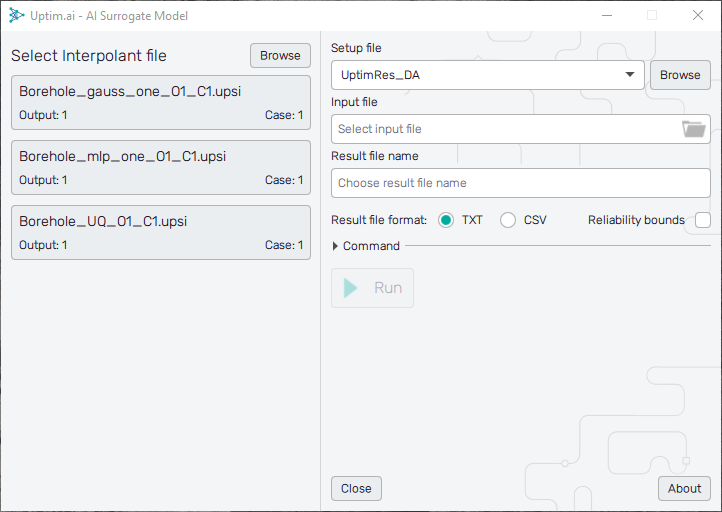
On the right side of the screen, the following information and commands appear:
- Setup file
: Allows to select the
.jsonfile from the analysis, which gives additional information about the files. By default, if available, the filename of the setup file linked to the result file is used. - Input file
: It is necessary to select a
.txtfile with a comma-separated format that has the samples to be interpolated. Needs to have the same format as the Data file generated in the Input Preprocessor. - Result file name : Name that will have the result file.
- Result file format : Format of the file with interpolated results. Two options are available, txt or csv.
- Reliability bounds
: Export reliability bounds computed for the model. It will appear as a set of two separate files in the same
formatting as the interpolated results, containing absolute output values of predicted reliability bounds.
Bounds files will have suffixes to their names,
_LBfor the lower bound and_UBfor the upper bound. - Command : When all the necessary information is filled, shows the command that if put in the console generates the result file. It is useful in cases of automation of several different interpolations inside a user's script.
- Run : Runs the interpolant and generates the result file.
- Show results : Button that appears when the interpolation process is finished that opens the result file.
The About button on the bottom right shows the menu dedicated to accessing the link to this document (Help), contacting Uptimai company to get the support (Company), and showing the information about the currently installed version of the program (Version).