PDF Report
The Uptimai Postprocessing tool offers a number of features that give a variety of information in the form of tables and plots. These can be exported separately in each feature, where their appearance can be adjusted. However, when a summary of all graphical outputs is required, it is more practical to generate the document in an automated way.
How to use the interface
The PDF report feature initiates a pop-up sheet with a list of available items that can be included
in the report. These will appear as active checkboxes on the sheet. Those that remain disabled are
usually not available either due to the method used for the generation of the *.upst or due to the used
version of the Core Solver.
Entries of the report are grouped into the following Document sections:
- Runtime information : Summary of information about the used HW, operational system, version of the Uptimai software and times of the beginning of the model computation and storing of the results.
- Input definition : List of input files of the project together with a summary of input variables and their ranges.
- Case setup
: The content of the Core Solver Setup
*.jsonfile used to generate the model. - Sensitivity analysis : Plots and tables of the Sensitivity analysis. It is possible to include only sensitivities of variables or increment functions.
- Increment functions : Plots of responses of the output to variations in values of selected input variable or combinations of input variables.
- Total increment functions : Plots of the summary of responses of the output to variations in values of selected combination of input variables.
- Full histogram : The probability density function of all Monte Carlo samples, includes variations in all input variables.
- Partial histograms / Influencer : The probability density function of Monte Carlo samples where only variations of selected input variables are considered. Other variables are assumed to have the value of the nominal solution.
- Regions of minimum/maximum : Histograms of input variable values optimized to increase the probability of lower/higher values of the output.
- Postprocess / Anomaly detection : Evaluation of the surrogate model quality with corresponding plots and tables of detected anomalies in results.
- Model properties and configuration : Review of enhancement models used for building the result of the Data Analysis method.
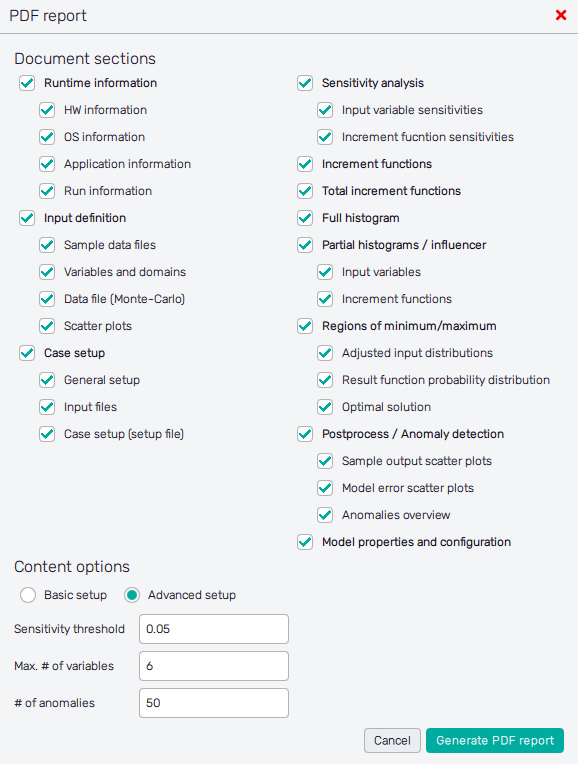
Content options
It is possible to choose the complexity and the level of detail of the document content. Mainly it is decided if e.g. plots related to certain variables or increment functions are included. The criteria for including input variables and increment functions in the report are:
- Sensitivity threshold : Only input variables and increment functions with a Sensitivity higher than the value in the setting will be included.
- Max. # of variables : Limit for number of variables described in the report.
- # of anomalies : Limit for number of anomalies listed in the Anomalies overview table
These values can be set manually by the user as the Advanced setup, or it is possible to select one of the options listed in the drop-down menu of the Basic setup. Note that values set to turn the limit off.
| Setup level | Senitivity threshold | Max. # of variables | # of anomalies |
|---|---|---|---|
| Basic | 0.05 | 6 | 35 |
| Medium | 0.02 | 10 | 100 |
| Detailed | 0.01 | 20 | 200 |
| Full | -1 | -1 | -1 |