Selection of Files
Data Propagator is a feature currently available for methods that create a full mathematical model. Its purpose is the evaluation of data against the model, e.g. the user can see if the model built from computed results is valid for measurement, new measurements are in line with previous ones or are most likely outliers, etc.
The evaluation is done for a specific output of the loaded .upst file.
How to use the interface
For accessing the Data Propagator feature, it needs to be selected directly
from one output model (similarly to all the other features, from a .upst file). Once it is
selected, a pop-up window to select files to be loaded will appear as can be seen in
Figure 1.
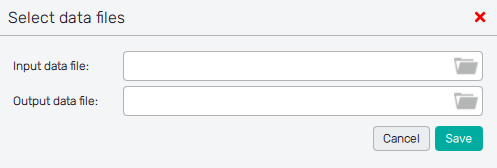
The feature expects comma-separated plain text files without a header. The files required are:
- Input data file : Coordinates of samples to be propagated through the model for the comparison. The formatting of the file is the same as for the Data file generated in the Input Preprocessor.
- Output data file : Contains results corresponding to coordinates in the loaded Input data file. It must have the same number of lines. Data of one output are assumed in the file (the file consists of one column of values).
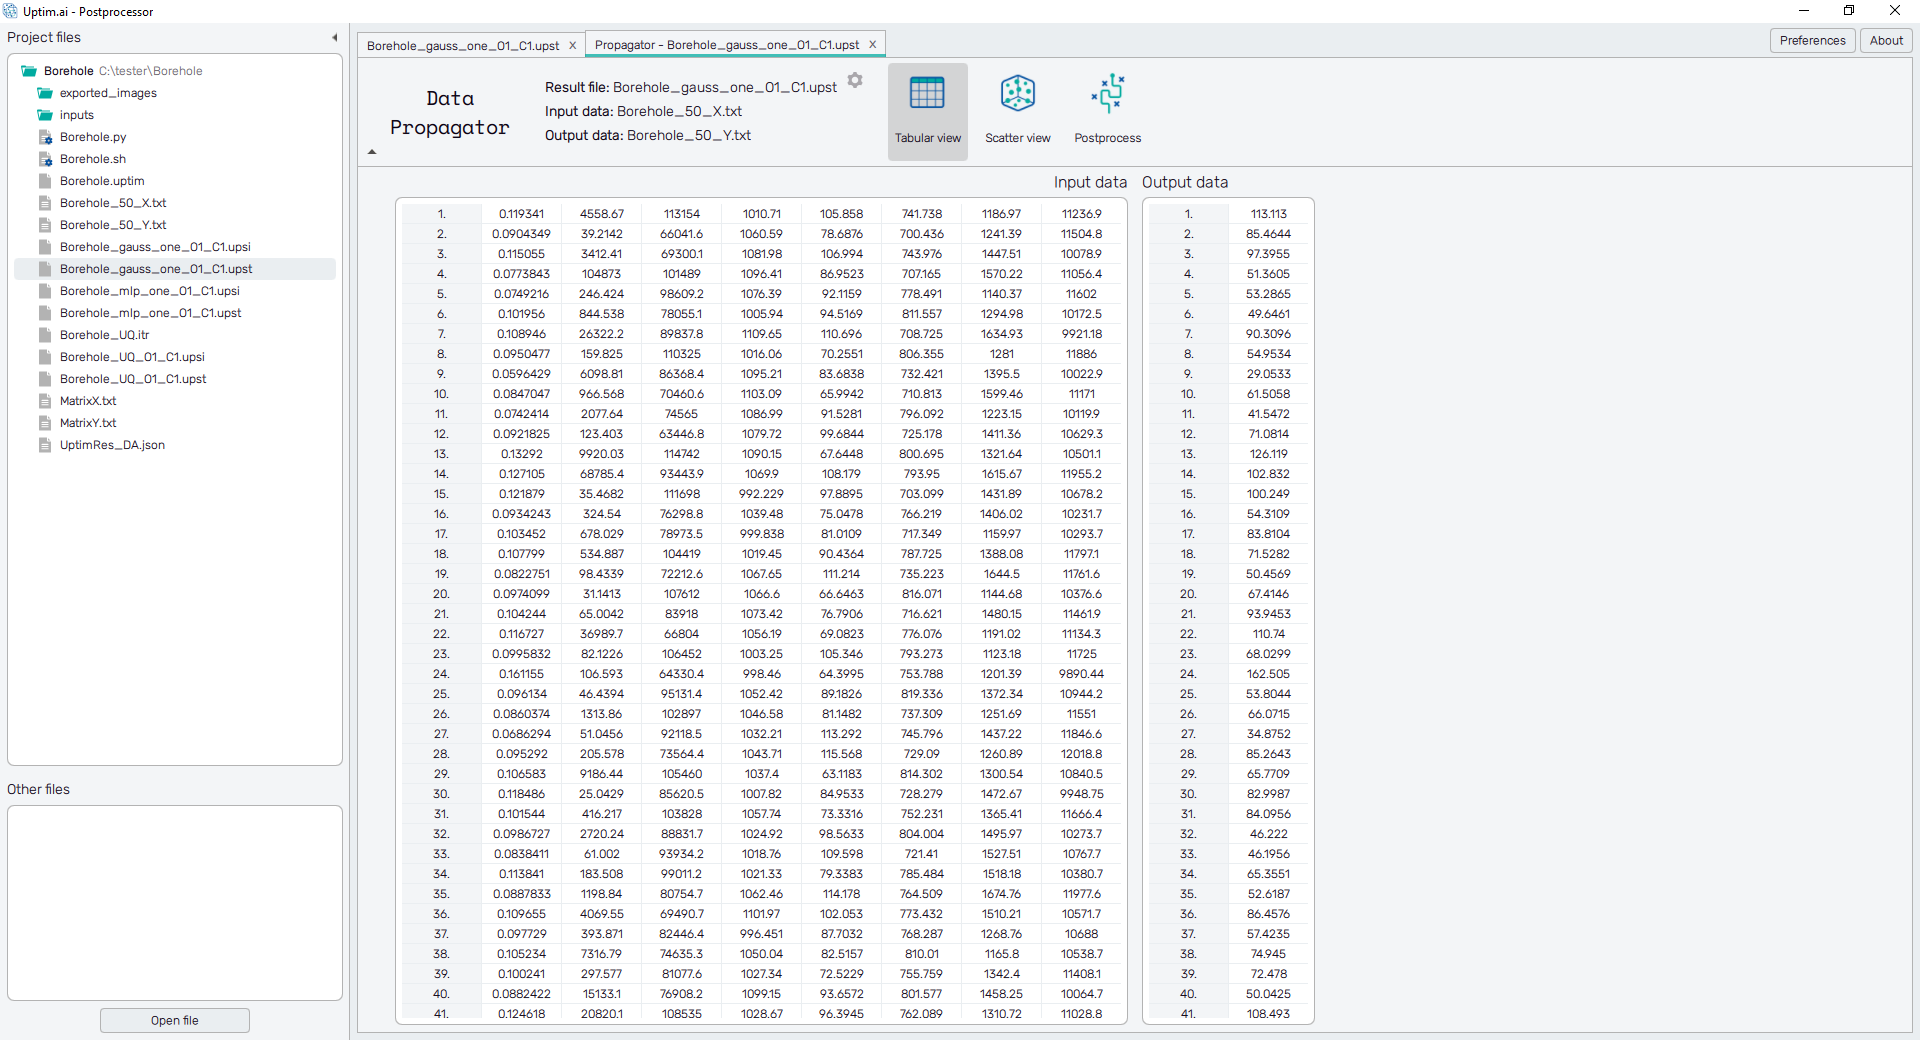
The user can see currently selected files at the top section of the screen right next to the list of available features. The selection of files can be modified at any time via the dialogue under the ⚙ icon. The Data Propagator opens a new tab where three sub-features are available in the top-bar.
Tabular view
Immediately after the selection of files, their content is shown in two tables labelled Input data and Output data. Here the user can review the loaded data. Typical issues with the compatibility of files are the different number of samples of Input and Output files, and also more than one column in the Output data. In case of issues, the user is informed about the possible cause in a message appearing in red above the tables.
Only if correct data is loaded, the user is allowed to proceed to the Scatter plot and Postprocess features of the Data propagator.