Run Solver
Running the Uptimai Solver is the last stage of the automation session. The Automation fully controls the process of the solver and, eventually, processes of the coupling pipeline.
How to use the interface
The majority of the screen is taken by the field of the core solver log. At its top right, three buttons allow you to switch between standard output (stdout), standard error (stderr), and the joined log from both. The joined log is stored in a file in case this was turned on in the General setup stage of the automation process.
The main control is at the top left, right under the fishbone navigation bar - the Run solver button. Clicking the button runs the solver, and eventually raises the dialog in case there are progress files of a previous computation that might be reused. When the solver is running, the button turns red and the label changes to 'Stop Solver' and then to 'Run again' when the solver stops working.
The button is followed by the additional status message informing the user about the current solver's state:
- Ready : The solver is ready to be started with the Run Solver/Run again button.
- Starting : Before the solver actually starts, the Automation reviews available temporary files and database entries from the previous run. A dialogue is raised where the user decides what can be used for the current run.
- Running : The solver is working.
- Stopped : The solver is not running, it was stopped by the user.
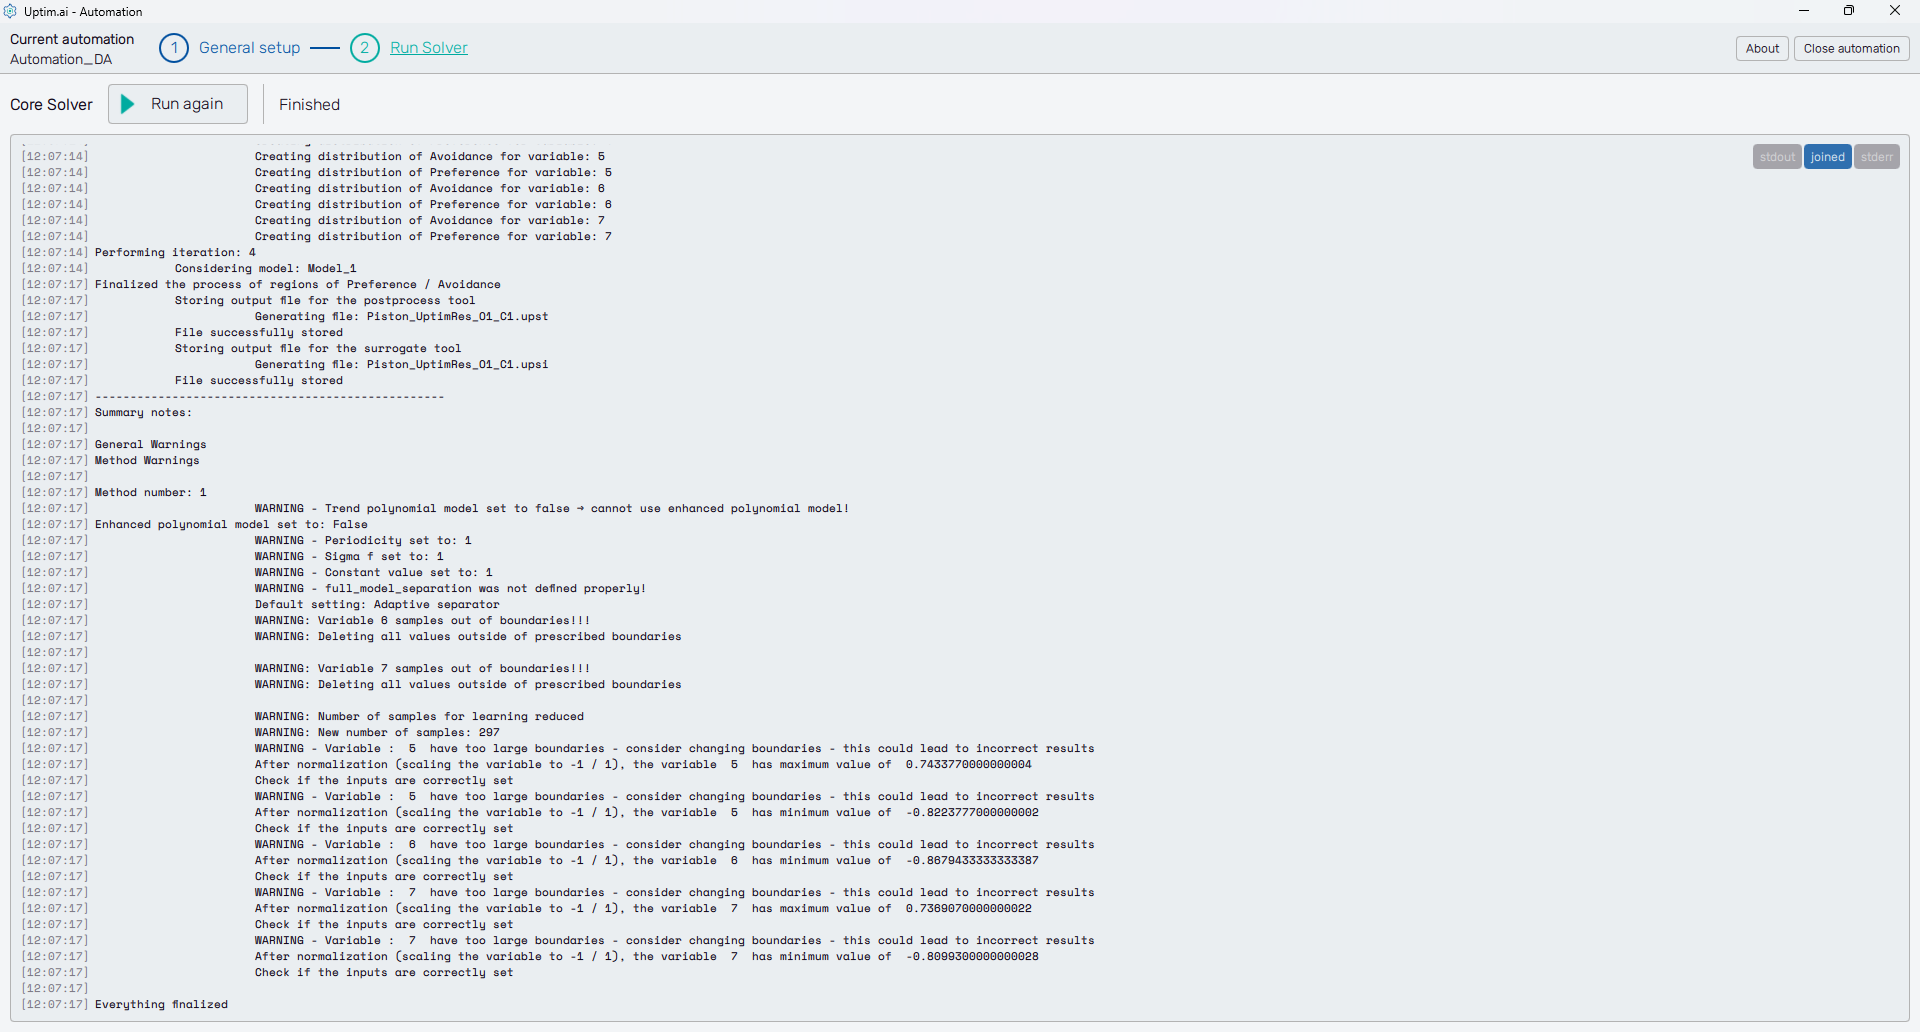
- Finished : The solver is not running, the model was successfully created. This is also indicated with the 'Everything finalized' message at the end of the log.
- Failed : The solver stopped with an error. See the details in the log that is also stored in
the
ERROR.logfile located in the project folder.
Coupling pipeline information
The Coupling section of the screen is present to the right from the log area in case of automation sessions using a Couplig pipeline. It holds the info about the progress of currently running pipelines. Also, users can access here data collected during previous iterations. For better orientation, samples are grouped under batches in the same order as these are called by the Uptimai Solver.
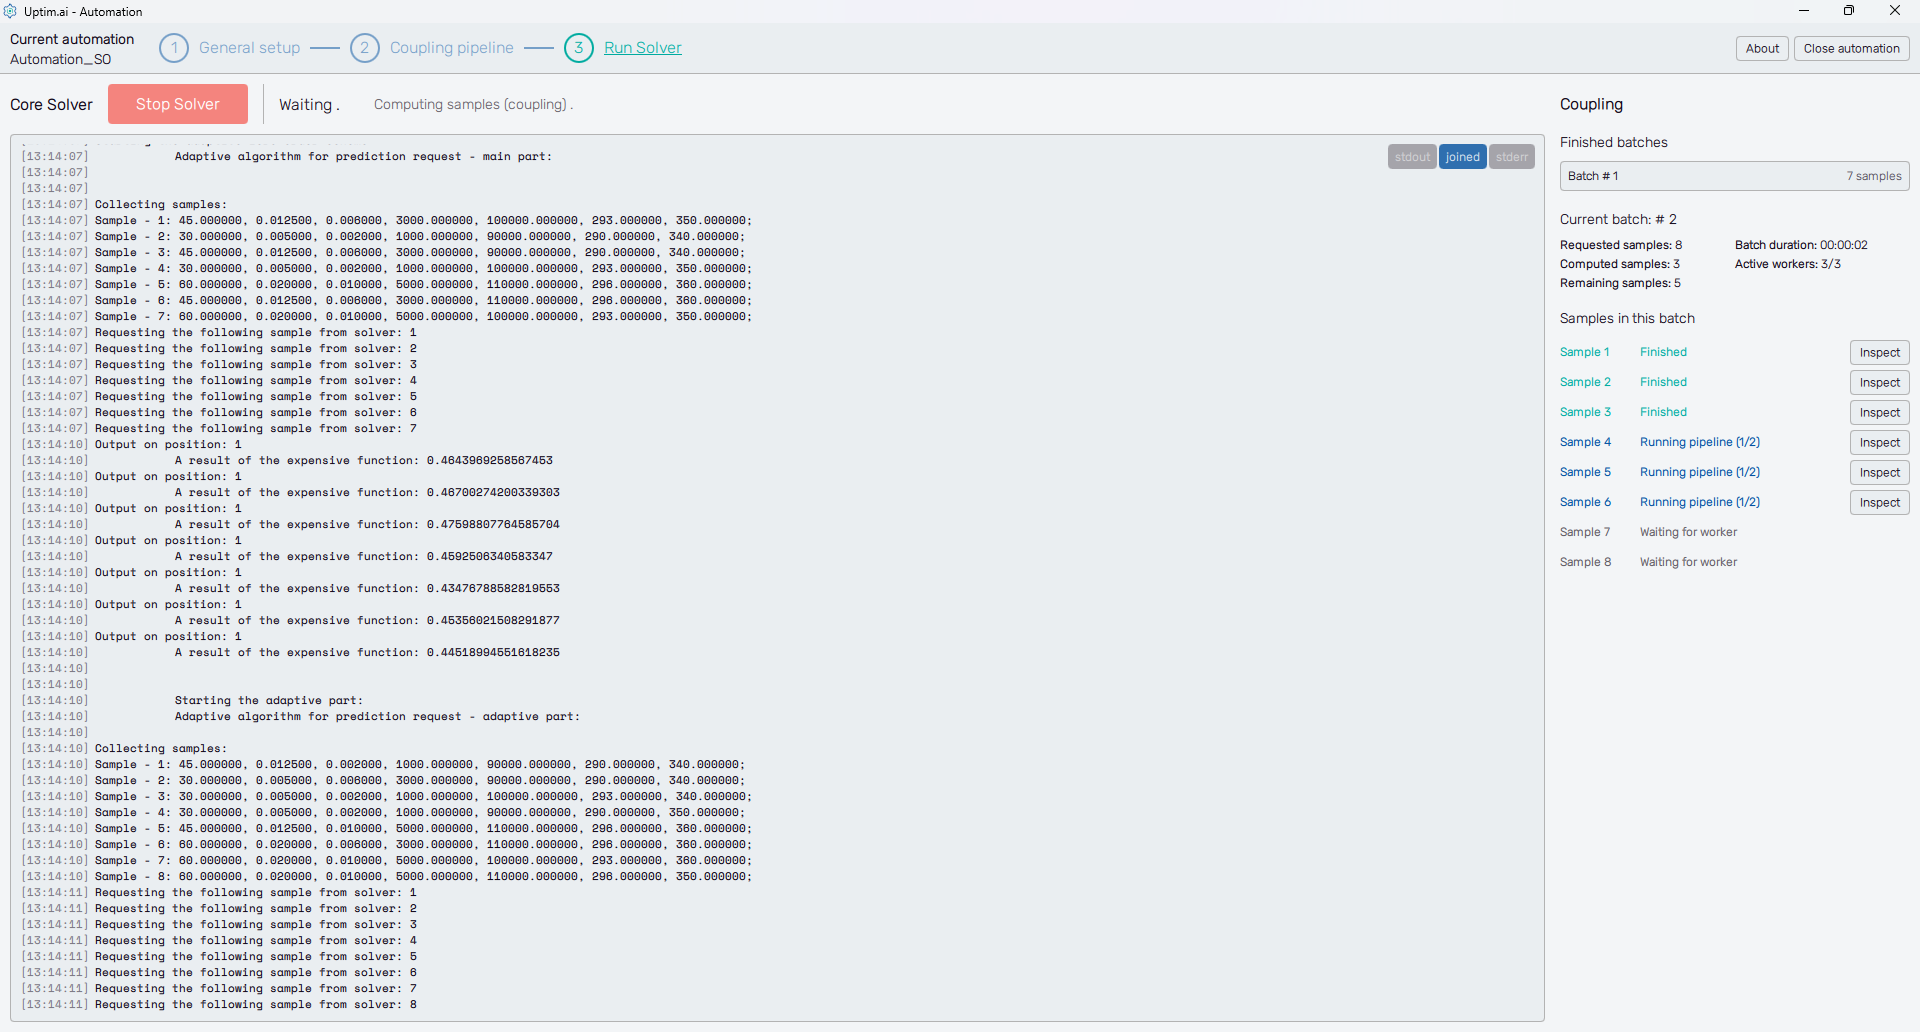
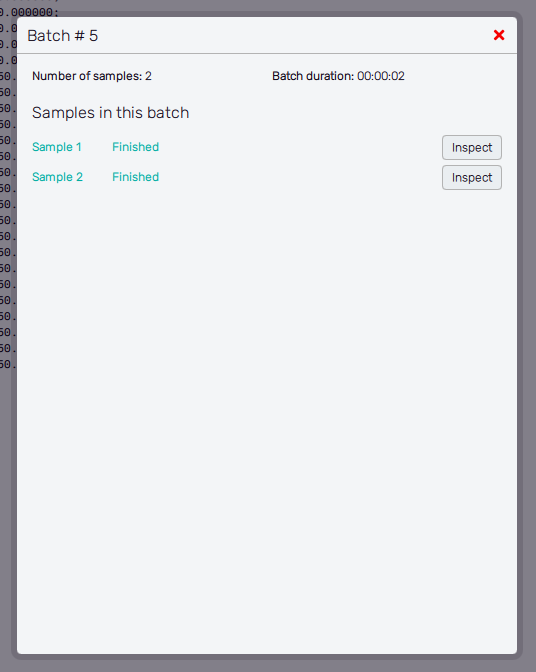
A list of already finished batches is placed on the top of the section under the Finished batches label. Each item of the list shows the number of the batch together with the number of samples in the batch. The item itself is clickable and opens a pop-up window accessing details of each retrieved sample. In general, it contains the same info and controls as the Current batch and the Samples in batch sections located underneath the Finished batches list.
For each batch, users can see the total number of Requested samples called by the Uptimai Solver. The Computed samples indicator shows the number of successfully finished pipelines while the Remaining samples indicates how many coupling pipelines are either being processed or waiting in the queue. The Batch duration is the elapsed time when at least one pipeline was active. The activity is summed by the number of Active workers indicating how many available worker slots are running a coupling pipeline.
The Samples in batch shows the complete list of samples in the currently solved batch with corresponding details. The sample number if followed by the coupling pipeline status:
- Loaded : Output values were found in the batch cache, so there is no need to run the coupling pipeline of this sample.
- Waiting for worker : There isn't an available worker at the moment, the sample waits for other pipelines to be finished.
- Running pipeline : The coupling pipeline is currently running. The additional information in brackets shows the progress - which of the steps defined for the pipeline is being processed.
- Failed : An error occurred in one of the pipeline steps, getting output values from the coupling pipeline failed.
- Stopped : The coupling pipeline was stopped by the user.
- Set manually : Output values were set by the user, typically after the pipeline failure.
- Finished : The pipeline provided all requested output values and finished successfully. The worker became available for another coupling pipeline.
Coupling pipeline inspection
The pipeline progress can be reviewed for all coupling pipelines that have at least started. There is an Inspect button for each of these pipelines, accessible either directly from the Samples in batch section of the main window of the GUI (Figure 2) or from the pop-up window initiated through an item of the Finished batches list (Figure 3). It opens a separate window dedicated to the particular sample showing all coupling pipeline steps, as shown in the example in Figure 4.
The header shows the number of the selected sample and the number of the batch the sample belongs to. When the pipeline is running, the Status shows which step is currently being solved. Duration measures the time when the pipeline was actively running, the clock stops when the pipeline is finished or one of its steps fails.
Each step has a separate section in the window. The Output check step is added automatically to each coupling pipeline, thus, there will be at least two steps in a valid coupling pipeline to be inspected. Clicking the header expands or collapses the examined step. The icon on the left of the header indicates its status graphically. It is either waiting to be processed, running, skipped or failed. The header also holds additional information, such as the name of the coupled script or program, asserting conditions, names of processed files, or the number of files to be copied or deleted. Note from Figure 4 that headers respect the possibility of dynamic handling of variable values.
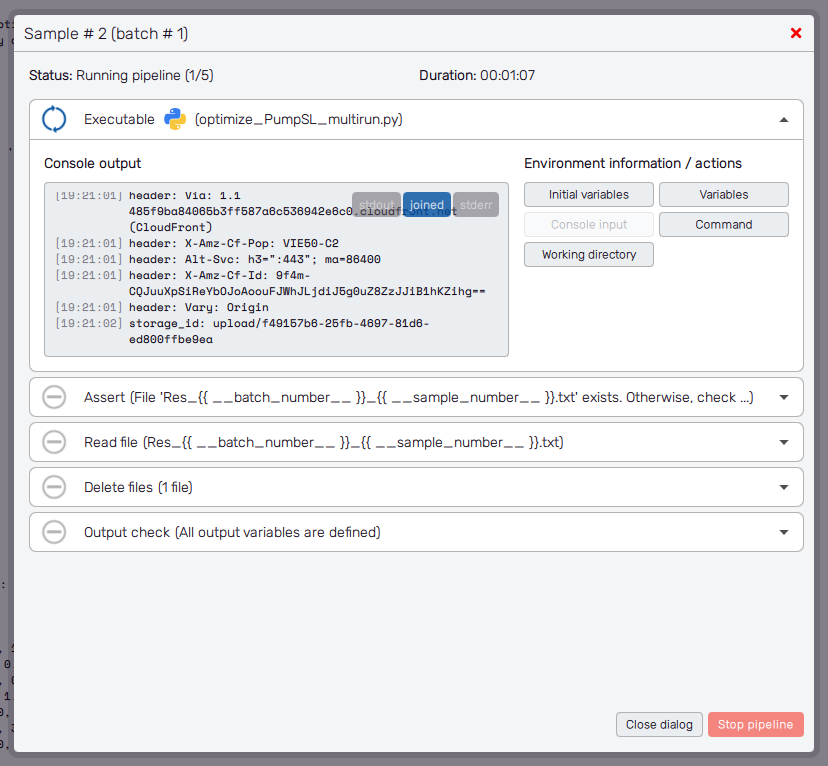
For each step, there is the Environment information/actions section on the right. It gives information about the current state of variables, files, and data being exchanged in the process of coupling. Each button opens a pop-up window with the specific info, the list of buttons may change according to the type of the pipeline step.
- Initial variables : Values of variables before the run of the selected step.
- Variables : Values after the step is processed.
- Console input : Entry used for the console.
- Command : The complete command used to call the executable or script, including used arguments.
- Working directory : Working directory of the coupled executable or script.
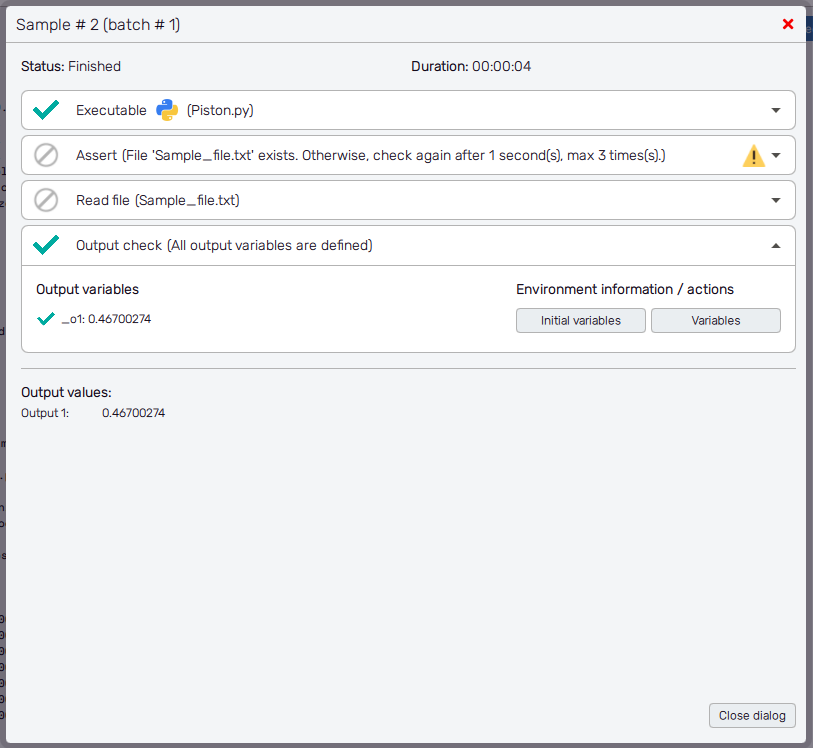
When the pipeline is running, there are two buttons at the bottom of the window. The Close dialog button returns the user to the main screen of the Automation GUI. The Close dialog button is also the only one left for pipelines that are not running. The Stop pipeline button ends the process of the worker assigned to the selected pipeline. However, the Solver is still running and all other pipelines are processed as they are in the queue. The stopped pipeline can be handled in the same way as the failed one. The successfully finished pipeline shows a summary of extracted Output values under the list of pipeline steps, as seen in Figure 5
Failed pipeline
Once a pipeline step is not able to finish (typically due to an error), the whole pipeline is labelled as failed and its worker is assigned to another pipeline in the queue. The inspection of the pipeline is then a key element for debugging such a pipeline.
An example of the failed pipeline is in Figure 6. The failed step of the pipeline is marked with an x icon in its header. Clicking and un-rolling the step shows the details about the nature of the pipeline step failure. For the Executable type of step, the user can review the Console output of the coupled executable in the same manner as in the case of the console output of the Solver. Note that for some definitions of the Assert type of pipeline step is the step failure an expected behaviour where the user's action is required.
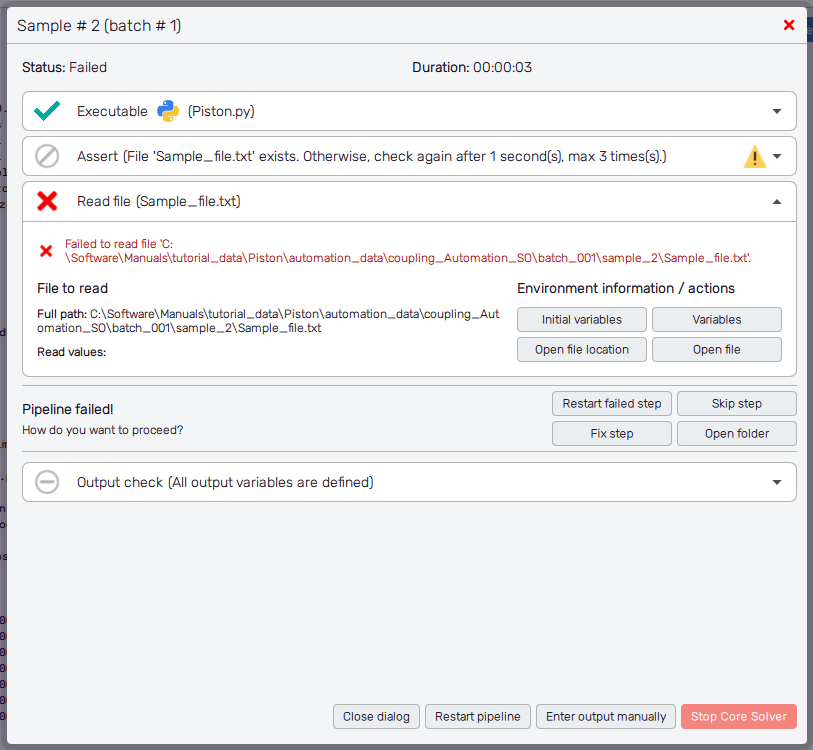
There are four types of actions possible for the currently managed failed pipeline step, available through buttons right underneath:
- Restart failed step : Runs the failed step once again with the same set of Initial variables as in the last attempt. E.g. for situations where the connection with the coupled executable was lost, there was an unexpected delay in the file writing process, etc.
- Skip step : Ignores the status of the current step and continues to the next one in the pipeline. However, this may lead to the failure of these subsequent steps because no values of variables were updated and potentially required files might be missing as well.
- Open folder : Opens the file explorer from the current working directory.
- Fix step : Allows the user to search for missing files or to edit values of user-defined variables. These will be used in the next step of the pipeline once the edit is confirmed.
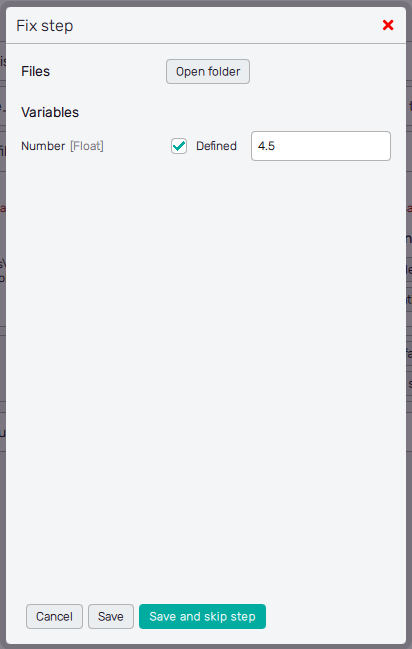
The Fix step dialog window is in Figure 7. Again, the function allows to show Files in the working directory with the Open folder button. Then, there is a list of variables with yet unassigned values. As in the list of Available variables known from the Coupling pipeline definition, the expected type of value is shown next to the variable name. The Defined switch indicates the corresponding variable's value will be set in this particular coupling pipeline step and activates the entry next to it. The Fix step action can be aborted with the Cancel button at the bottom of the dialog window. The Save button confirms the changes, while the Save and skip step buttons also makes the pipeline continue right away.
Actions of restarting, skipping, and fixing failed pipeline steps are available only when the Solver is still running! The same applies to restarting the whole pipeline or entering the value of output manually.
Also, there are actions available for the whole coupling pipeline and Solver accessible with control buttons at the very bottom of the inspection dialog window:
- Close dialog : Closes the dialog window of the coupling pipeline inspection.
- Restart pipeline : Runs the failed pipeline once again with the same set of Initial variables as at the beginning of the last attempt to run the pipeline.
- Stop Core Solver : Stops the Solver completely and returns the user to the main window of the GUI. Also, all running pipelines will be terminated with it.
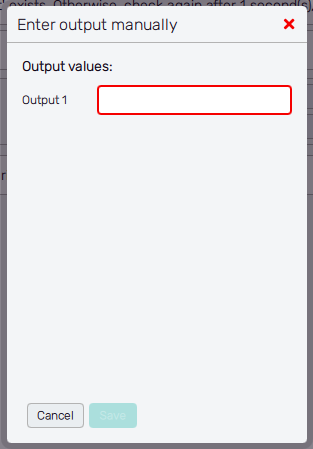
- Enter output manually : This opens the dialog where the user can manually set the values of all outputs that were not collected so far during the pipeline run.
Figure 8 shows the Enter output manually dialog window. Here, is the list of yet-undefined Output values. Entering all required fields activates the Save button at the bottom of the window that saves all entries and closes the dialog. To leave the dialog without saving changes to output values, use the Close button.