Optimum
The .upsg file is generated only with a run of the
Statistical Optimization
method and stores the global
information of the optimization process, such as the domain reduction for each input and the
optimum position.
Optimized histograms represent a new approach to optimization and design improvement. It is a statistical approach to optimization, which defines a region that gives stable statistical improvement taking into account the uncertainty of the variables. Due to the statistical nature of the optimization, setting only a few variables to the region of preference will still lead to an improvement in the final design. However, the improvement will not be as large as predicted by our code. Nevertheless, this allows for improving the final design according to criteria, which are not (or cannot) be specified.
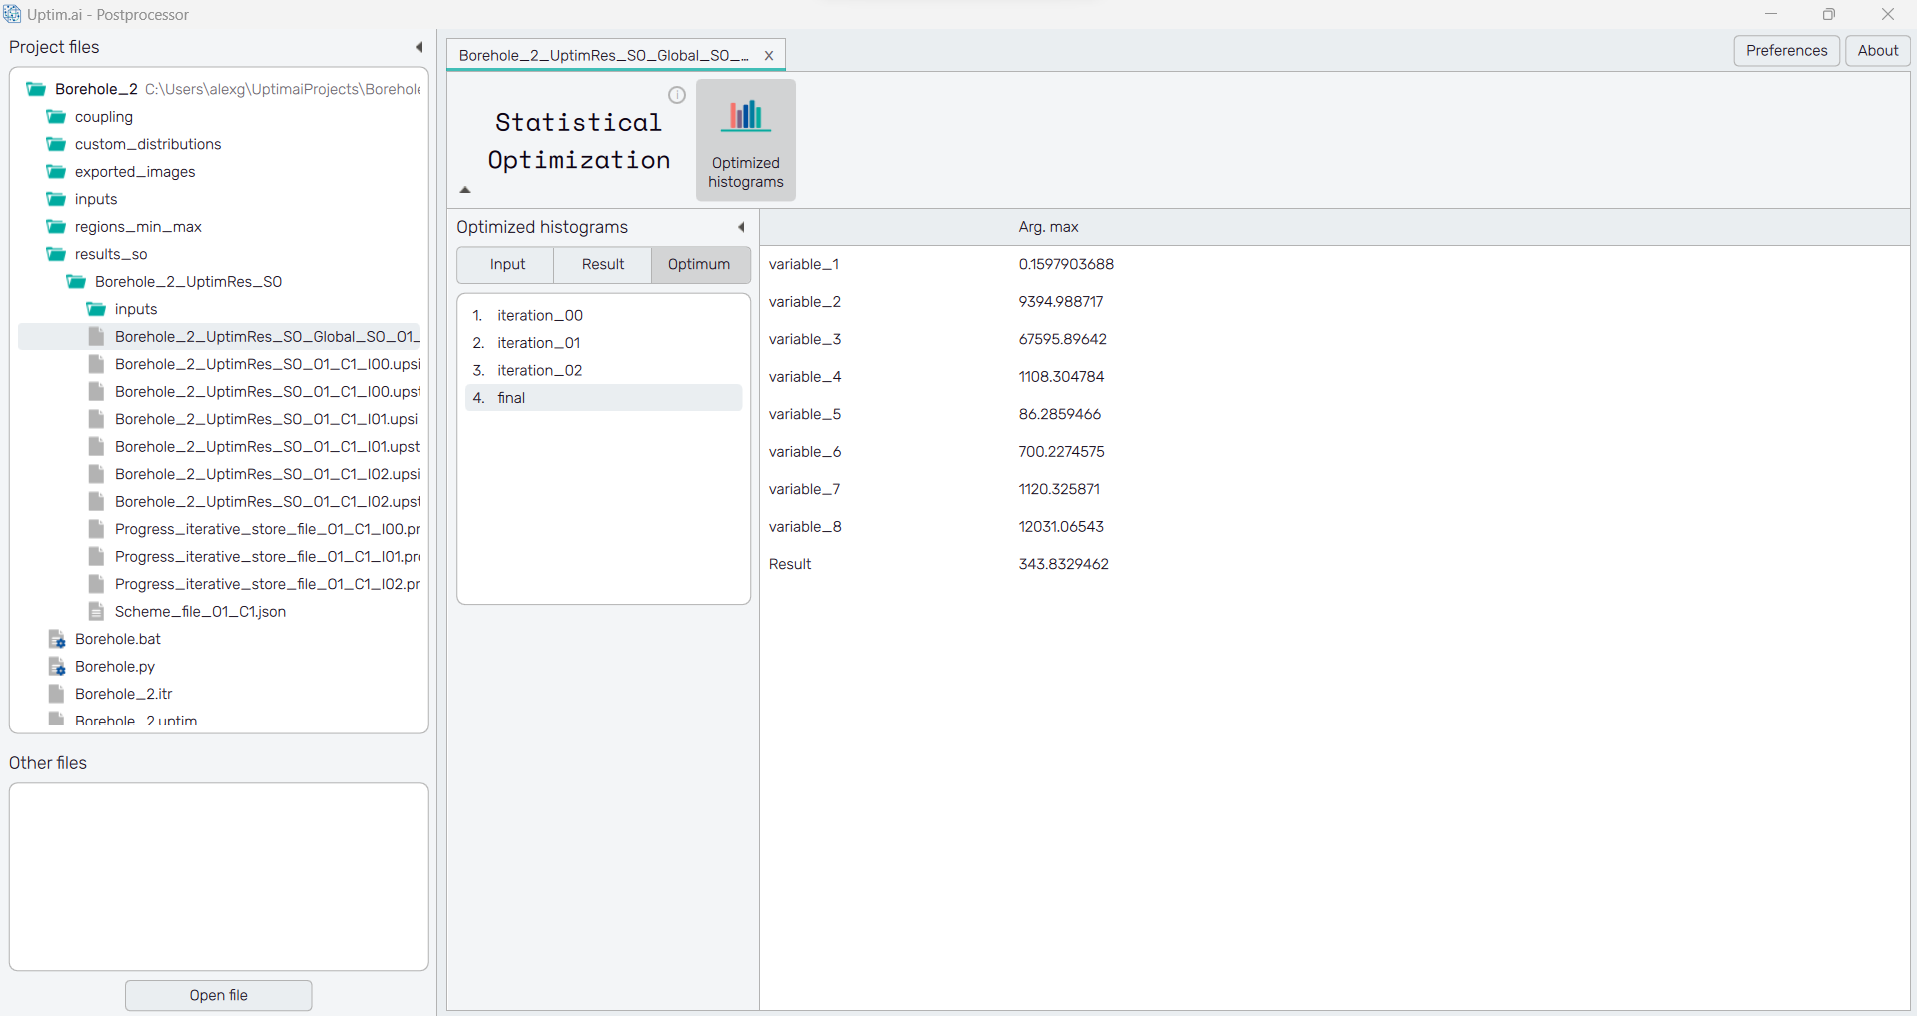
The section Optimum shows the global optimum values of the output function and the combination of inputs that define it. These values are shown for all different models and the final distribution.

How to use the interface
There is a collapsible box on the left side of the tab with the opened result file, where the user can set the data to be displayed. On top of the box, there are three buttons to switch between modes of the Optimized histograms feature. The Input button refers to the display of distributions of input variables, the Result button shows modified probability distributions of the resulting function value, and the Optimum button accesses the best-known solution from the plot and corresponding values of input variables.
Under the Optimized histograms label, there is a table with all the different iterations computed, as well as the final distribution. Choosing the iteration displays the combination of variables that give the absolute optimum obtained in that specific model. The absolute best expected point is under the final distribution. Note that this value is obtained from propagating the Monte-Carlo samples through the model, thus, it has to be taken just as a hint.