Inputs
The .upsg file is generated only with a run of the
Statistical Optimization
method and stores the global
information of the optimization process, such as the domain reduction for each input and the
optimum position.
Optimized histograms represent a new approach to optimization and design improvement. It is a statistical approach to optimization, which defines a region that gives stable statistical improvement taking into account the uncertainty of the variables. Due to the statistical nature of the optimization, setting only a few variables to the region of preference will still lead to an improvement in the final design. However, the improvement will not be as large as predicted by our code. Nevertheless, this allows for improving the final design according to criteria, which are not (or cannot) be specified.
In the section Input are shown input distributions with their preferred region for every computed model, and the final distribution. This preferred distribution shows how the domain has been reduced at every step of the optimization process, and which is the final range the solution must be in.
How to use the interface
There is a collapsible box on the left side of the tab with the opened result file, where the user can set the data to be displayed. On top of the box, there are three buttons to switch between modes of the Optimized histograms feature. The Input button refers to the display of distributions of input variables, the Result button shows modified probability distributions of the resulting function value, and the Optimum button accesses the best-known solution from the plot and corresponding values of input variables.
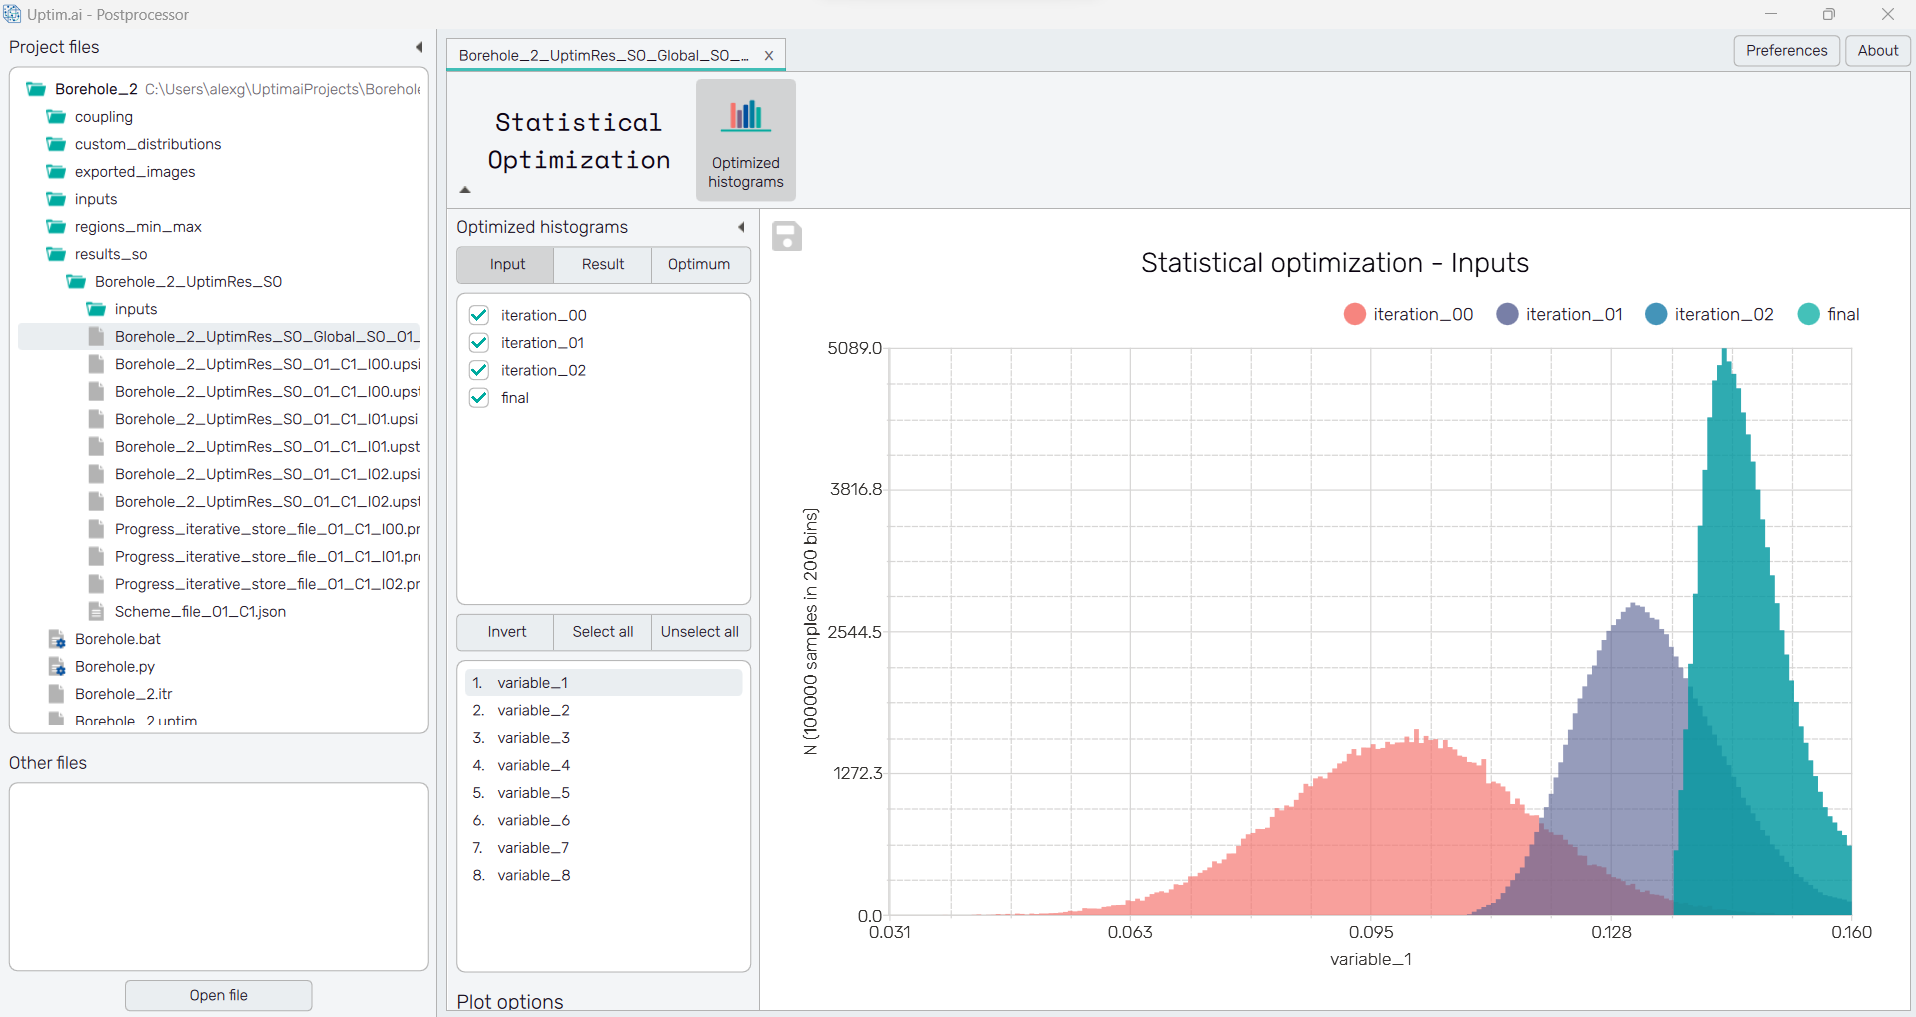
Under the Optimized histograms label, there is a checkbox list with all the different iterations computed, as well as the final distribution. That allows to display of the distributions wanted. By default, all the distributions are shown. The selection of items can be also modified with three buttons under the list. The Invert button does the reverse action of all checkboxes in the list. Select all and Unselect all buttons turn all checkboxes on/off. Below, there is a list of all input variables of the project. The user can choose the input variable to display by clicking the name of the desired variable.
To export the plot as a .png or .jpg file, the save-file dialogue can be induced
by clicking the 💾 icon on the top left of the plot.
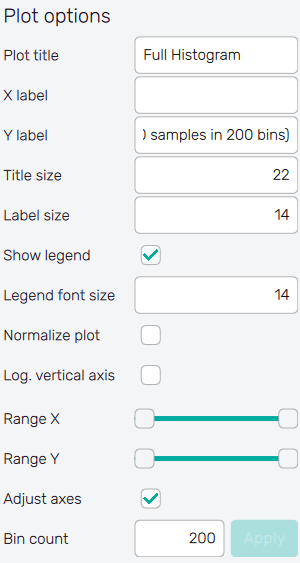
It is possible to adjust the appearance of the plot using controls from
the Plot options section of the panel on the left:
-
Plot title : Title of the graph, Statistical optimization - Inputs by default.
-
X label : Label of the X axis, name of the selected variable by default.
-
Y label : Label of the Y axis, N by default together with info about the number of samples used for visualization and the current number of bins.
-
Title size : Size of the title font.
-
Label size : Size of the label font.
-
Show legend : Switching on/off the legend of the plot.
-
Legend font size : Size of the legend font.
-
Normalize plot : Normalization of histogram plot, toggle on/off.
-
Log. vertical axis : Logarithmic scale of vertical axis, toggle on/off.
-
Range X : Double-sided slider allowing to show a slice of the data in detail. Dragging one of the slider's points limits the depicted range of bins, one can move with the section along the X-axis by dragging the green bar of the slider (both edge points are highlighted).
-
Range Y : Double-sided slider allowing to show a slice of the data in detail. Dragging one of the slider's points limits the depicted number of samples in bin/density, one can move with the section along the Y-axis by dragging the green bar of the slider (both edge points are highlighted).
All ranges in the plot can be also precisely using the ⚙ icon on the right of each slider. This opens a sub-dialogue with entry fields for writing exact values of range limits. These need to be confirmed with the Set button. Setting values outside domain's boundaries will reset range limits to the default state.
-
Adjust axes : Toggle if the axis limits of the plot should be only the range adjusted with the slider above (on) or the full range of function values and density/number of samples in bins (off).
-
Bin count : Number of categories in the histogram.