Anomalies position
This *.upsg file is generated only with a run of the Data Analysis (multiple datasets) method
and stores the global information of all the built models, such as the relationship between them and the
position of the anomalies.
It allows the user to have a detailed look at the behavior of all models at the same time, to understand the correlations, and to be able to quickly identify the models that are more interesting for the user. It also has a deep importance for the analysis of anomalies in multidimensional problems as it allows to identify the correlation of the position of anomalies between models, detecting where these anomalies are happening and giving insights on why are happening and how they could be mitigated.
In the section Anomalies position, it is shown a table with dimensions (number of bins x number of models), and for each interval of the bin it states for each model if there are anomalies present or not.
How to use the interface
The main visual of the tool is the Anomalies position table itself. Each column represents a model and each row represents an interval from the reference input. If the cell is coloured in green with a tick it means that there is an anomaly at that position in the specific model. This table allows for rapid comprehension of where the majority of the anomalies are located and the correlation between different models more locally than the Pearson correlation anomaly which is a global value of the whole domain.
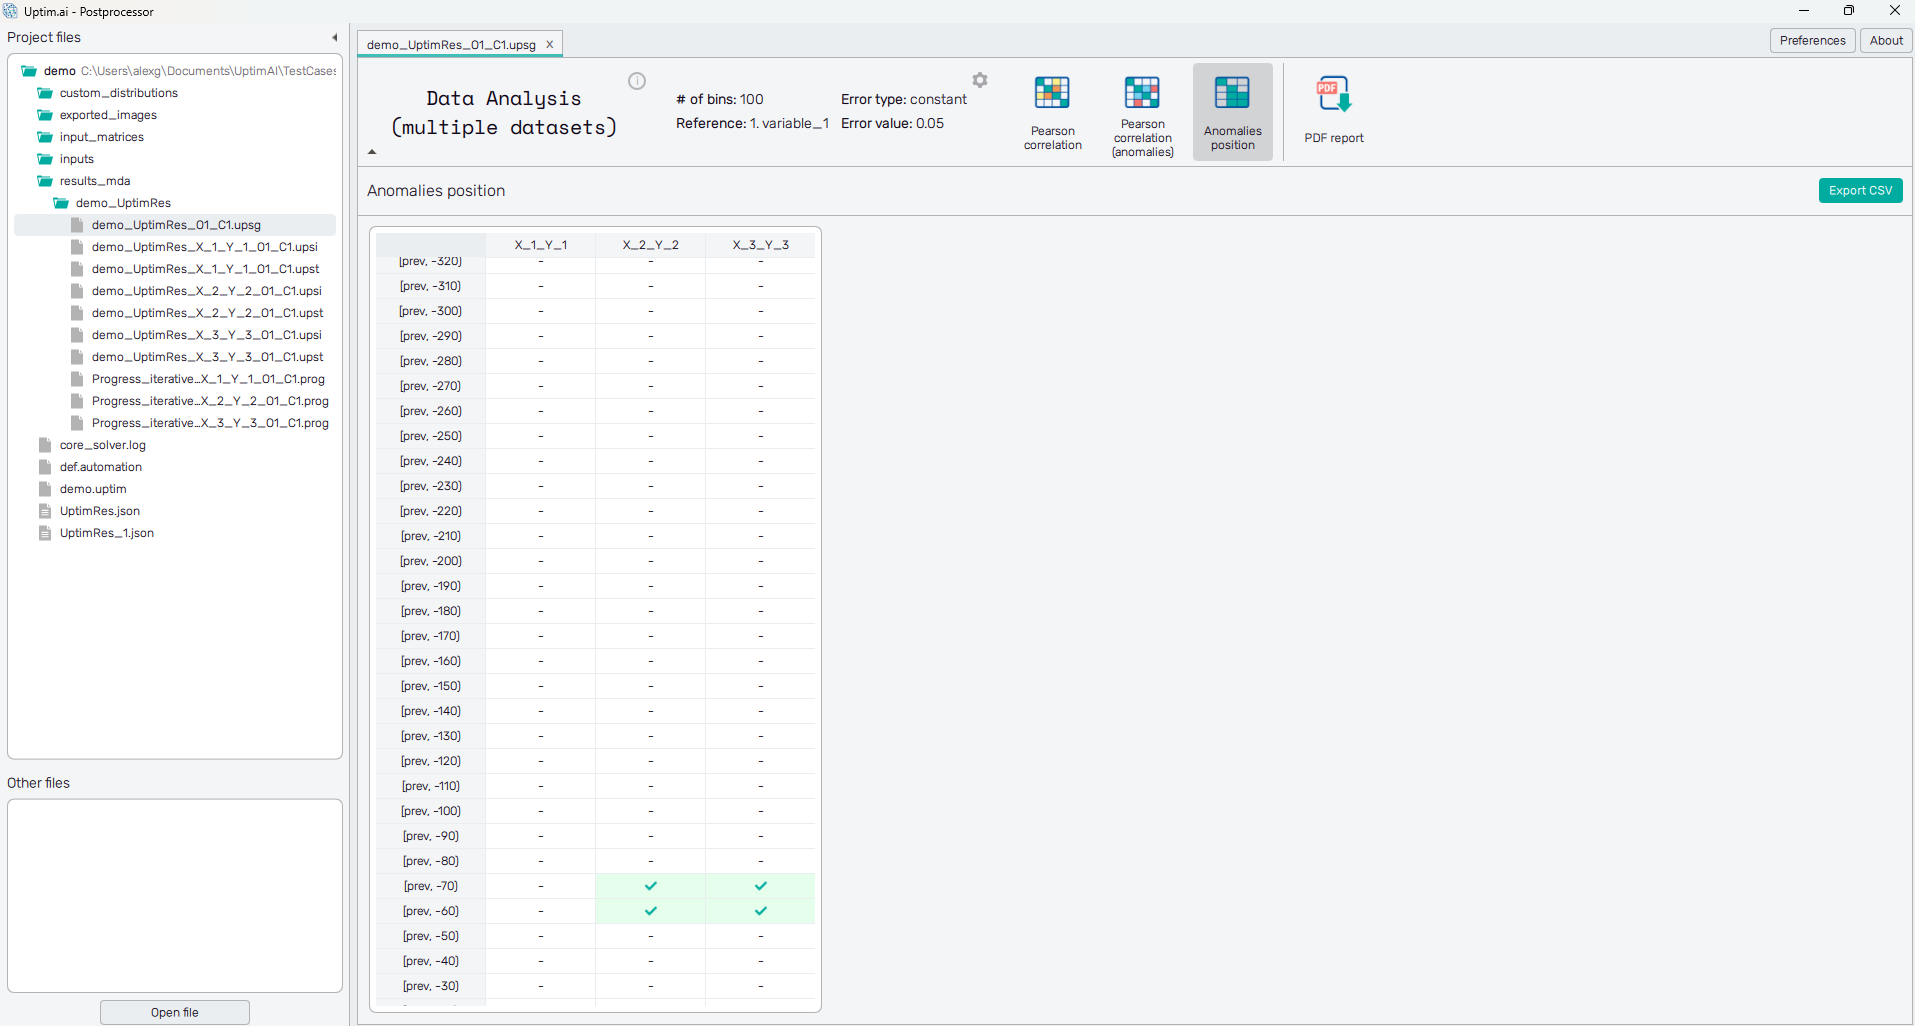
Above the table on the right, there is a button that allows the user to export the Pearson Correlation table in a *.csv format.
It is possible to change the Pearson settings at the top of the page under the ⚙ icon just to the left from
the selection of features.
When clicking a pop-up window appears, and allows you to change the four main Pearson settings, together with the name
of the new file to be generated. The Pearson settings are:
- Number_of_bins: It allows the user to select the number of bins (domain zones) in which the data will be structured to find anomaly correlations. The larger the number is, the closest two anomalies must be to be considered simultaneous.
- Error_type: It allows the user to select what kind of error is going to be used to detect anomalies. It can be constant, Chauvenet or IQR.
- Reference_input: It allows the user to choose the reference input against which the correlation study is done. In general, it is recommended to use time or a well-known input variable.
- Error_value: For constant errors, it sets which is the base error which is delimiting if it is an anomaly or not. The lower the value, the more sensible, and more anomalies will appear. It must be a value between and .
Once clicked the Generate new global result file button, a new *.upsg will be generated with the settings that were
selected, and it will be automatically opened in the Postprocessor main window.