Pearson Correlation Anomalies
This *.upsg file is generated only with a run of the Data Analysis (multiple datasets) method
and stores the global information of all the built models, such as the relationship between them and the
position of the anomalies.
It allows the user to have a detailed look at the behavior of all models at the same time, to understand the correlations, and to be able to quickly identify the models that are more interesting for the user. It also has a deep importance for the analysis of anomalies in multidimensional problems as it allows to identify the correlation of the position of anomalies between models, detecting where these anomalies are happening and giving insights on why are happening and how they could be mitigated.
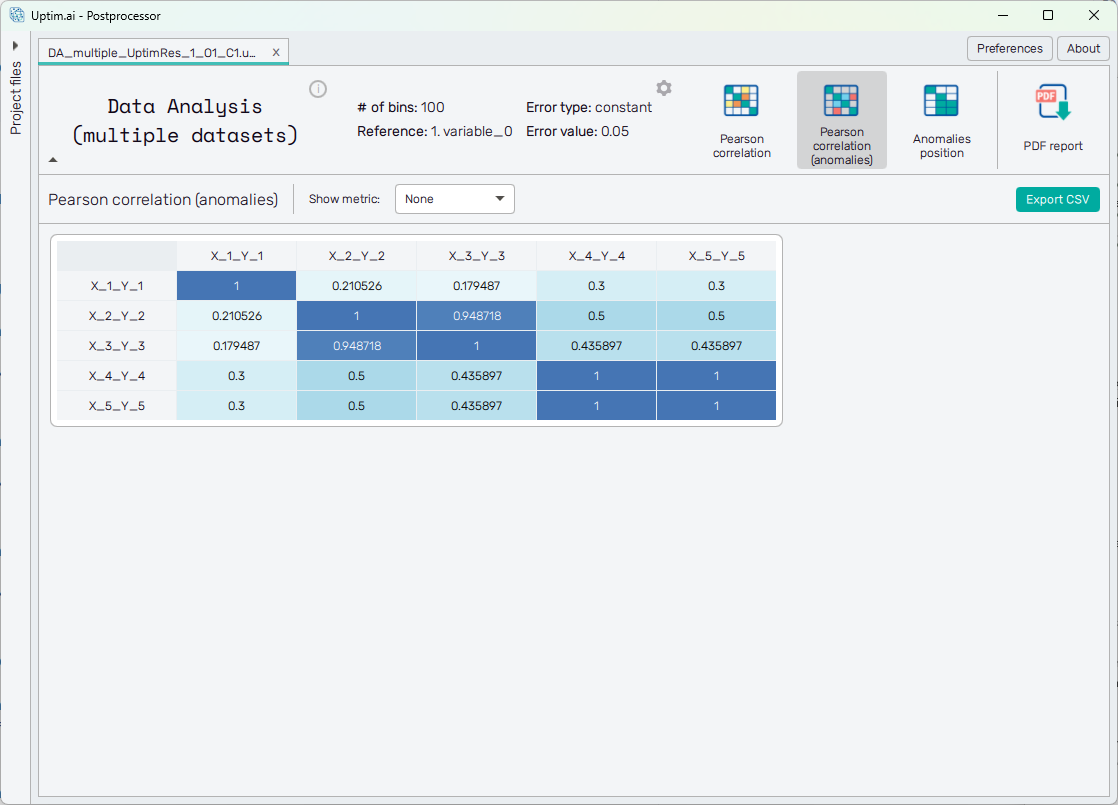
In the section Pearson Correlation Anomalies, the table is shown with the Pearson correlation values between the anomalies from all models. On both axes of the table, there is one model listed for each set of data loaded when defining inputs for the Data Analysis (multiple datasets) method. Values of the table tell how probable it is that an anomaly in one model corresponds to an anomaly in the other model. The Pearson correlation value is computed taking into account the position of the anomalies of each model against the reference input, which should be a recognized input as time, or an important input that can be used as a guideline. The values go from to , and the bigger it is the value, the higher the relation between the anomalies. In case, that the value is it means that there is no correlation at all between the anomalies.
How to use the interface
The main visual of the tool is the Pearson correlation anomalies table itself.
All cells of the table are clickable, giving direct access to further information.
The cells on the labels (names of the models) give access to the specific model (*.upst file), in which you
can navigate exactly as described in .upst section of the documentation, and the cells on the table itself to the comparison
outputs, giving more details about the exact relation between variables.
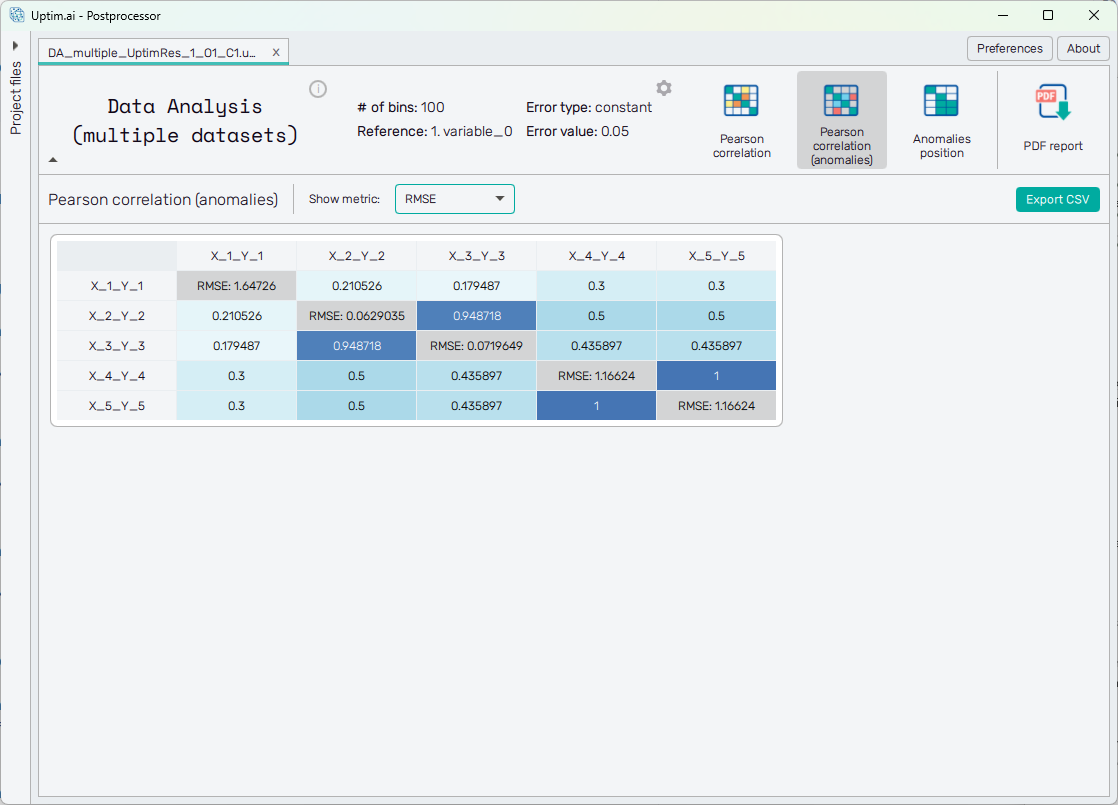
Using the Show metric select box, the user can choose to display model metrics on the diagonal instead of the correlation value (which is always 1). The example below shows the RMSE metric.
Above the table on the right, there is a button that allows the user to export the Pearson Correlation table in a *.csv format.
It is possible to change the Pearson settings at the top of the page under the ⚙ icon just to the left from
the selection of features.
When clicking a pop-up window appears, and allows you to change the four main Pearson settings, together with the name
of the new file to be generated. The Pearson settings are:
- Number_of_bins: It allows the user to select the number of bins (domain zones) in which the data will be structured to find anomaly correlations. The larger the number is, the closest two anomalies must be to be considered simultaneous.
- Error_type: It allows the user to select what kind of error is going to be used to detect anomalies. It can be constant, Chauvenet or IQR.
- Reference_input: It allows the user to choose the reference input against which the correlation study is done. In general, it is recommended to use time or a well-known input variable.
- Error_value: For constant errors, it sets which is the base error which is delimiting if it is an anomaly or not. The lower the value, the more sensible, and more anomalies will appear. It must be a value between and .
Once clicked the Generate new global result file button, a new *.upsg will be generated with the settings that were
selected, and it will be automatically opened in the Postprocessor main window.