Optim
Regions of minimum/maximum represent a new approach to optimization and design improvement. It is a statistical approach to optimization, which defines adjusted probability distributions and ranges of input variables to minimize or maximize the statistical factors of the probability distribution of the resulting function value.
Theory behind
The region of maximum is a new distribution for the input variable, which one wants to achieve to have a stable statistical increase in the function value. In other words, by properly truncating the input distribution, one can achieve an increase in the mean value of results. Contrary, the region of minimum represents a region, which leads to lower results in the final distribution. In other words, there will be a higher probability of obtaining results from the lower side of the spectrum of expected results. Nevertheless, these newly proposed regions of input variables may overlap. The overlap is closely connected to the influence/sensitivity of a given variable. For very influential variables, these regions will not overlap and one should avoid the region of avoidance as it will almost surely lead to bad final design. On the other hand, for non-influential variables, these regions will overlap and re-design the input distribution according to e.g. the region of maximum will lead to small change in the desired way. Due to the statistical nature of the optimization, setting only a few variables to the region of maximum will still lead to an increase in the final result. However, the increase will not be as large as predicted by our code. Nevertheless, this allows for improving the final design according to criteria, which are not (or cannot) be specified.
We define the region of maximum to be on the right side of the final distribution (maximization process) and the region of minimum on the left side of the final distribution.
The Optim mode of the Region of preference/avoidance feature shows the global maximum and minimum values of the output function and the combination of inputs that define it.
How to use the interface
There is a collapsible box on the left side of the tab with the opened result file, where the user can set the data to be displayed. On top of the box, there are three buttons to switch between modes of the Regions of minimum/maximum feature. The Input button refers to the display of distributions of input variables, the Result button shows modified probability distributions of the resulting function value, and the Optimum button accesses the best-known solution from the plot and corresponding values of input variables.
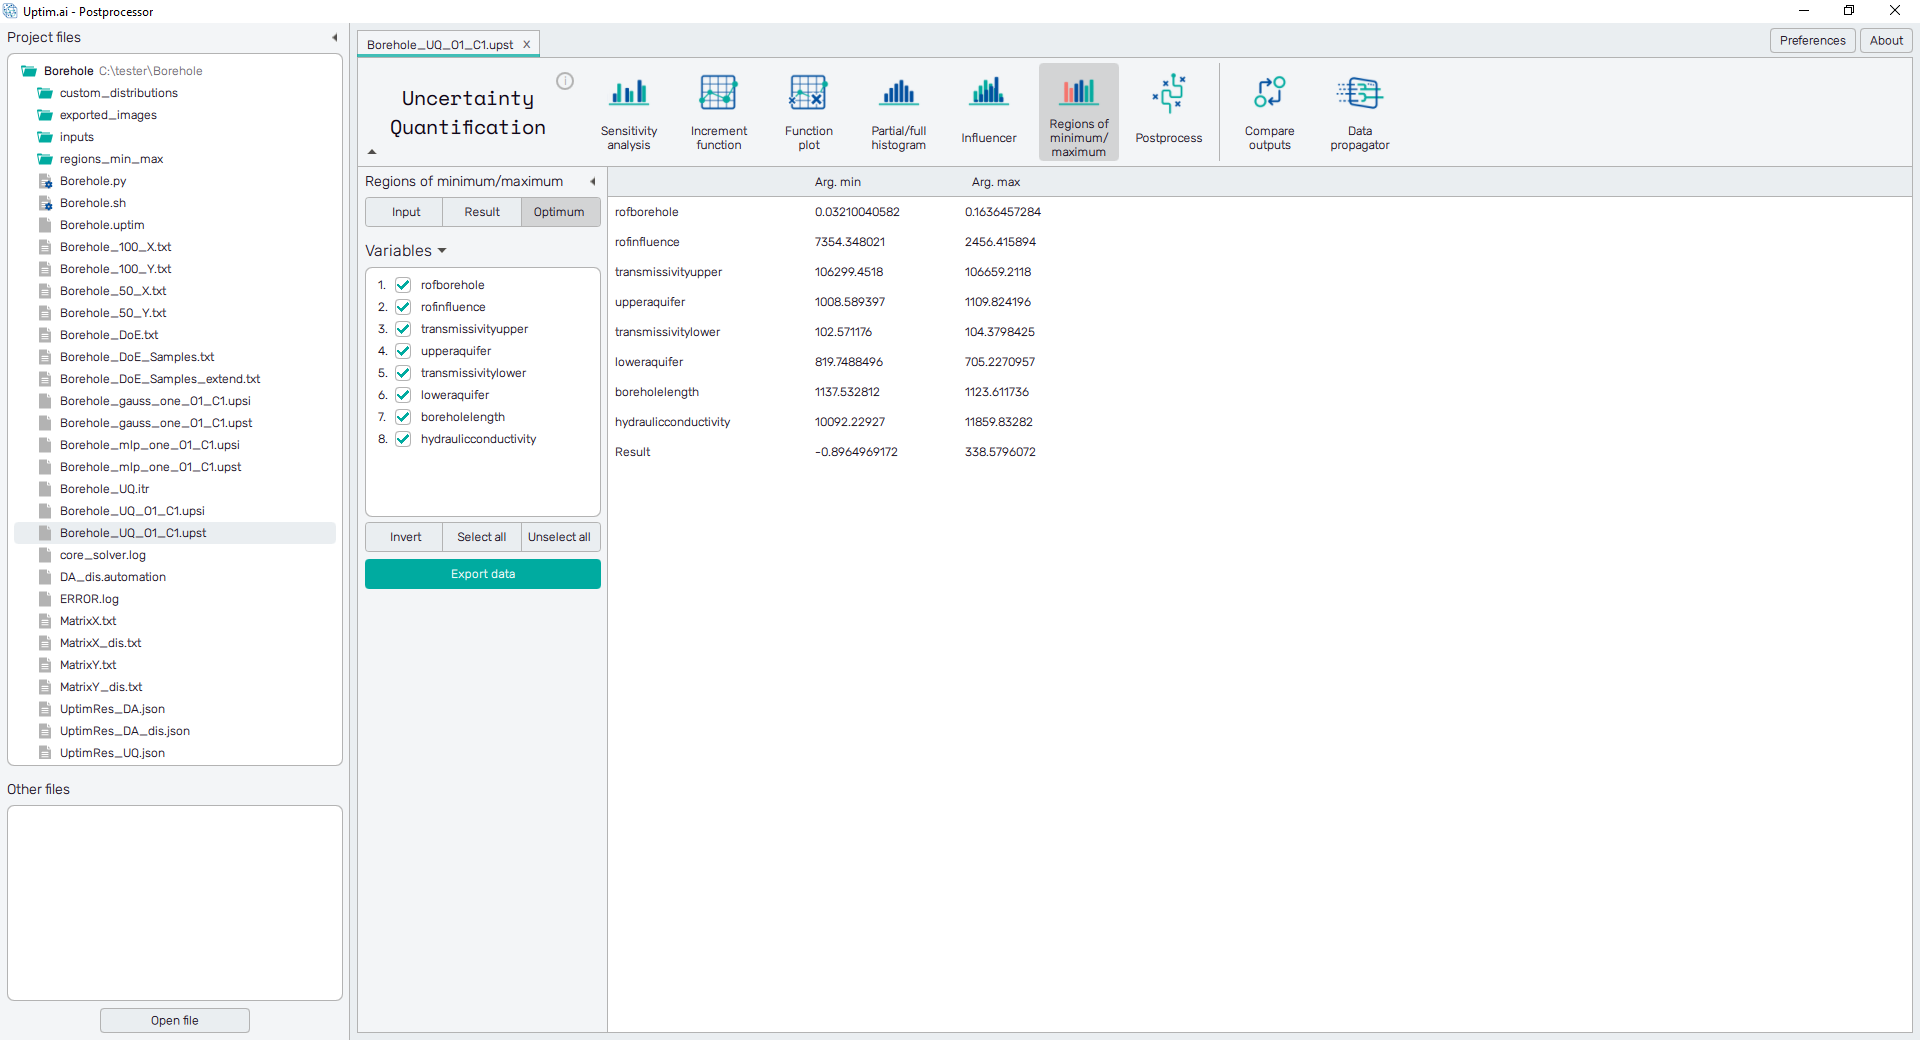
It is possible to include or exclude input variables and their regions of minimum/maximum from the computation of optimized result values via checkboxes next to each variable name. Original probability distributions will be used for all unselected inputs. The selection of items can be also modified with three buttons under the list. The Invert button does the reverse action of all checkboxes in the list. Select all and Unselect all buttons turn all checkboxes on/off. Every change applied to the selection of input variables will induce the computation of function values from the mathematical model.
The table user can see in the working frame of the tab presents absolute minimum and
maximum function values found for Monte Carlo sampling of input variables. It is shown
together with the corresponding values of inputs.
The green Export data button underneath the list of input variables
opens the file-save dialog exporting the currently displayed data to a
.csv or .txt file.