Results
Regions of minimum/maximum represent a new approach to optimization and design improvement. It is a statistical approach to optimization, which defines adjusted probability distributions and ranges of input variables to minimize or maximize the statistical factors of the probability distribution of the resulting function value.
Theory behind
The region of maximum is a new distribution for the input variable, which one wants to achieve to have a stable statistical increase in the function value. In other words, by properly truncating the input distribution, one can achieve an increase in the mean value of results. Contrary, the region of minimum represents a region, which leads to lower results in the final distribution. In other words, there will be a higher probability of obtaining results from the lower side of the spectrum of expected results. Nevertheless, these newly proposed regions of input variables may overlap. The overlap is closely connected to the influence/sensitivity of a given variable. For very influential variables, these regions will not overlap and one should avoid the region of avoidance as it will almost surely lead to bad final design. On the other hand, for non-influential variables, these regions will overlap and re-design the input distribution according to e.g. the region of maximum will lead to small change in the desired way. Due to the statistical nature of the optimization, setting only a few variables to the region of maximum will still lead to an increase in the final result. However, the increase will not be as large as predicted by our code. Nevertheless, this allows for improving the final design according to criteria, which are not (or cannot) be specified.
We define the region of maximum to be on the right side of the final distribution (maximization process) and the region of minimum on the left side of the final distribution.
How to use the interface
There is a collapsible box on the left side of the tab with the opened result file, where the user can set the data to be displayed. On top of the box, there are three buttons to switch between modes of the Regions of minimum/maximum feature. The Input button refers to the display of distributions of input variables, the Result button shows modified probability distributions of the resulting function value, and the Optimum button accesses the best-known solution from the plot and corresponding values of input variables.
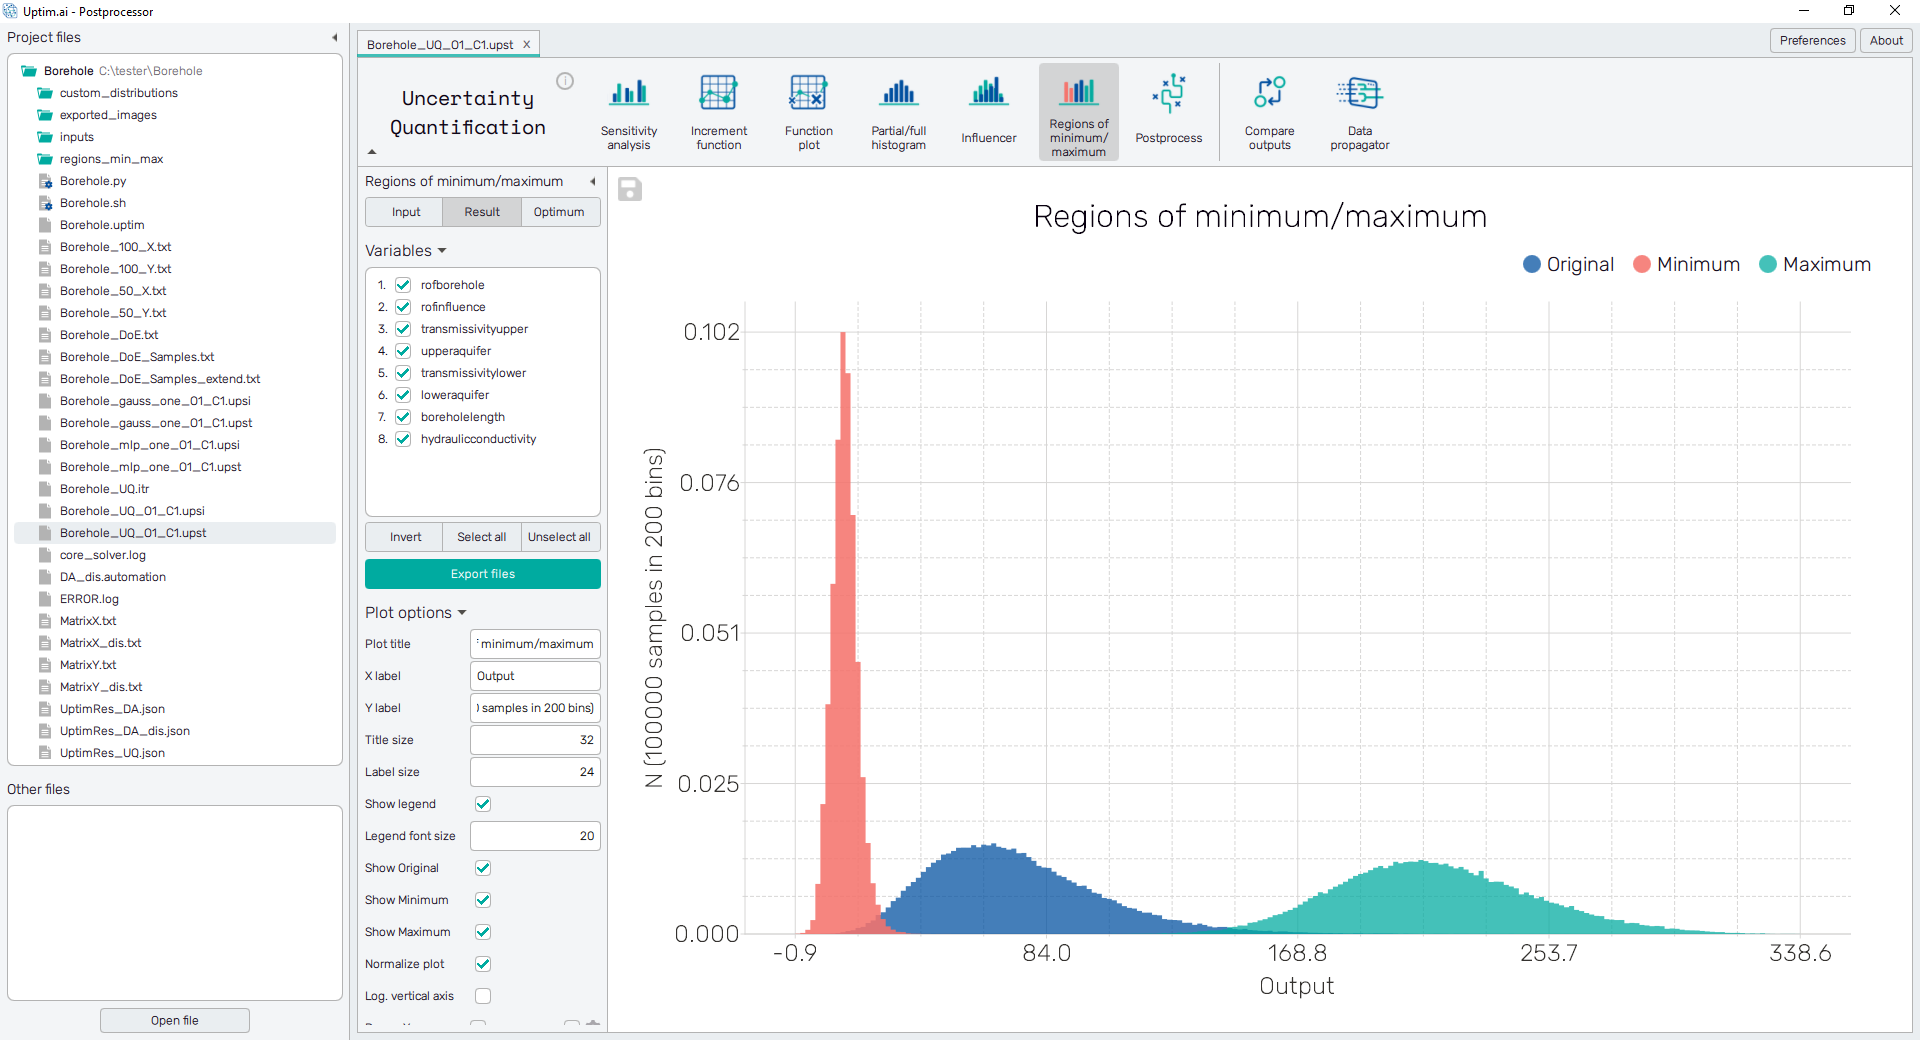
It is possible to include or exclude input variables and their regions of minimum/maximum from the computation of optimized result values via checkboxes next to each variable name. Original probability distributions will be used for all unselected inputs. The selection of items can be also modified with three buttons under the list. The Invert button does the reverse action of all checkboxes in the list. Select all and Unselect all buttons turn all checkboxes on/off. Every change applied to the selection of input variables will induce the computation of function values from the mathematical model.
The green Export data button underneath the list of input variables
saves the currently displayed data into a .csv or .txt file. Save-file dialog
will be shown where the user can set files to be saved with the Export button.
All details of files to be saved can be set by the user:
- Current variable file : File containing the list of input variables in the project with the description of their original probability distribution types and parameters.
- Options
: Setup of categories of files to be saved.
- Inputs : Generates Variable file, Domain file, and Data file of each input distribution (see the description for reference). Also, it will create files with the input variables' definition in the same format as for the Distribution creator feature of the Input Preprocessor.
- Outputs : Saves function values interpolated from the mathematical model.
- Minimum : Saves all aforementioned files for regions of minimum.
- Maximum : Saves all aforementioned files for regions of maximum.
- File prefix : Sets the prefix of the saved files.
- Select directory : Path to target destination of saved files.
To export the plot as a .png or .jpg file, the save-file dialogue can be induced
by clicking the 💾 icon on the top left of the plot.
It is possible to adjust the appearance of the plot using controls from
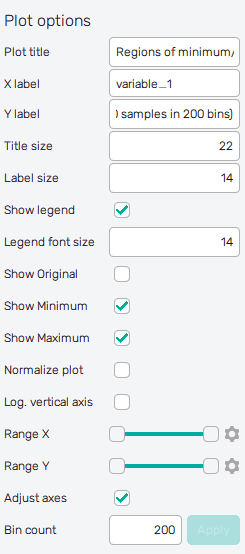
the Plot options section of the panel on the left:
-
Plot title : Displayed above the plot, Regions of minimum/maximum by default together with the name of the selected variable.
-
X label : Label of the X axis, by default name of the selected input variable.
-
Y label : Label of the Y axis, N by default together with info about the number of samples used for visualization and the current number of bins.
-
Title size : Size of the title font.
-
Label size : Size of the label font.
-
Show legend : Switching on/off the legend of the plot/the colorbar scale.
-
Legend font size : Size of the legend font.
-
Show Original : Switching on/off the histogram plot of the original distribution of the selected input variable.
-
Show Minimum : Switching on/off the histogram plot of the input region of minimum.
-
Show Maximum : Switching on/off the histogram plot of the input region of maximum.
-
Normalize Plot : Normalization of histogram plot, toggle on/off.
-
Log. vertical Axis : Logarithmic scale of vertical axis, toggle on/off.
-
Range X : Double-sided slider allowing to show a slice of the data in detail. Dragging one of the slider's points limits the depicted range of bins, one can move with the section along the X-axis by dragging the green bar of the slider (both edge points are highlighted).
-
Range Y : Double-sided slider allowing to show a slice of the data in detail. Dragging one of the slider's points limits the depicted number of samples in bin/density, one can move with the section along the Y-axis by dragging the green bar of the slider (both edge points are highlighted).
All ranges in the plot can be also precisely using the ⚙ icon on the right of each slider. This opens a sub-dialogue with entry fields for writing exact values of range limits. These need to be confirmed with the Set button. Setting values outside domain's boundaries will reset range limits to the default state.
-
Adjust axes : Toggle if the axis limits of the plot should be only the range adjusted with the slider above (on) or the full range of function values and density/number of samples in bins (off).
-
Bin Count : Number of categories in the histogram.