Parallel Coordinates Plot
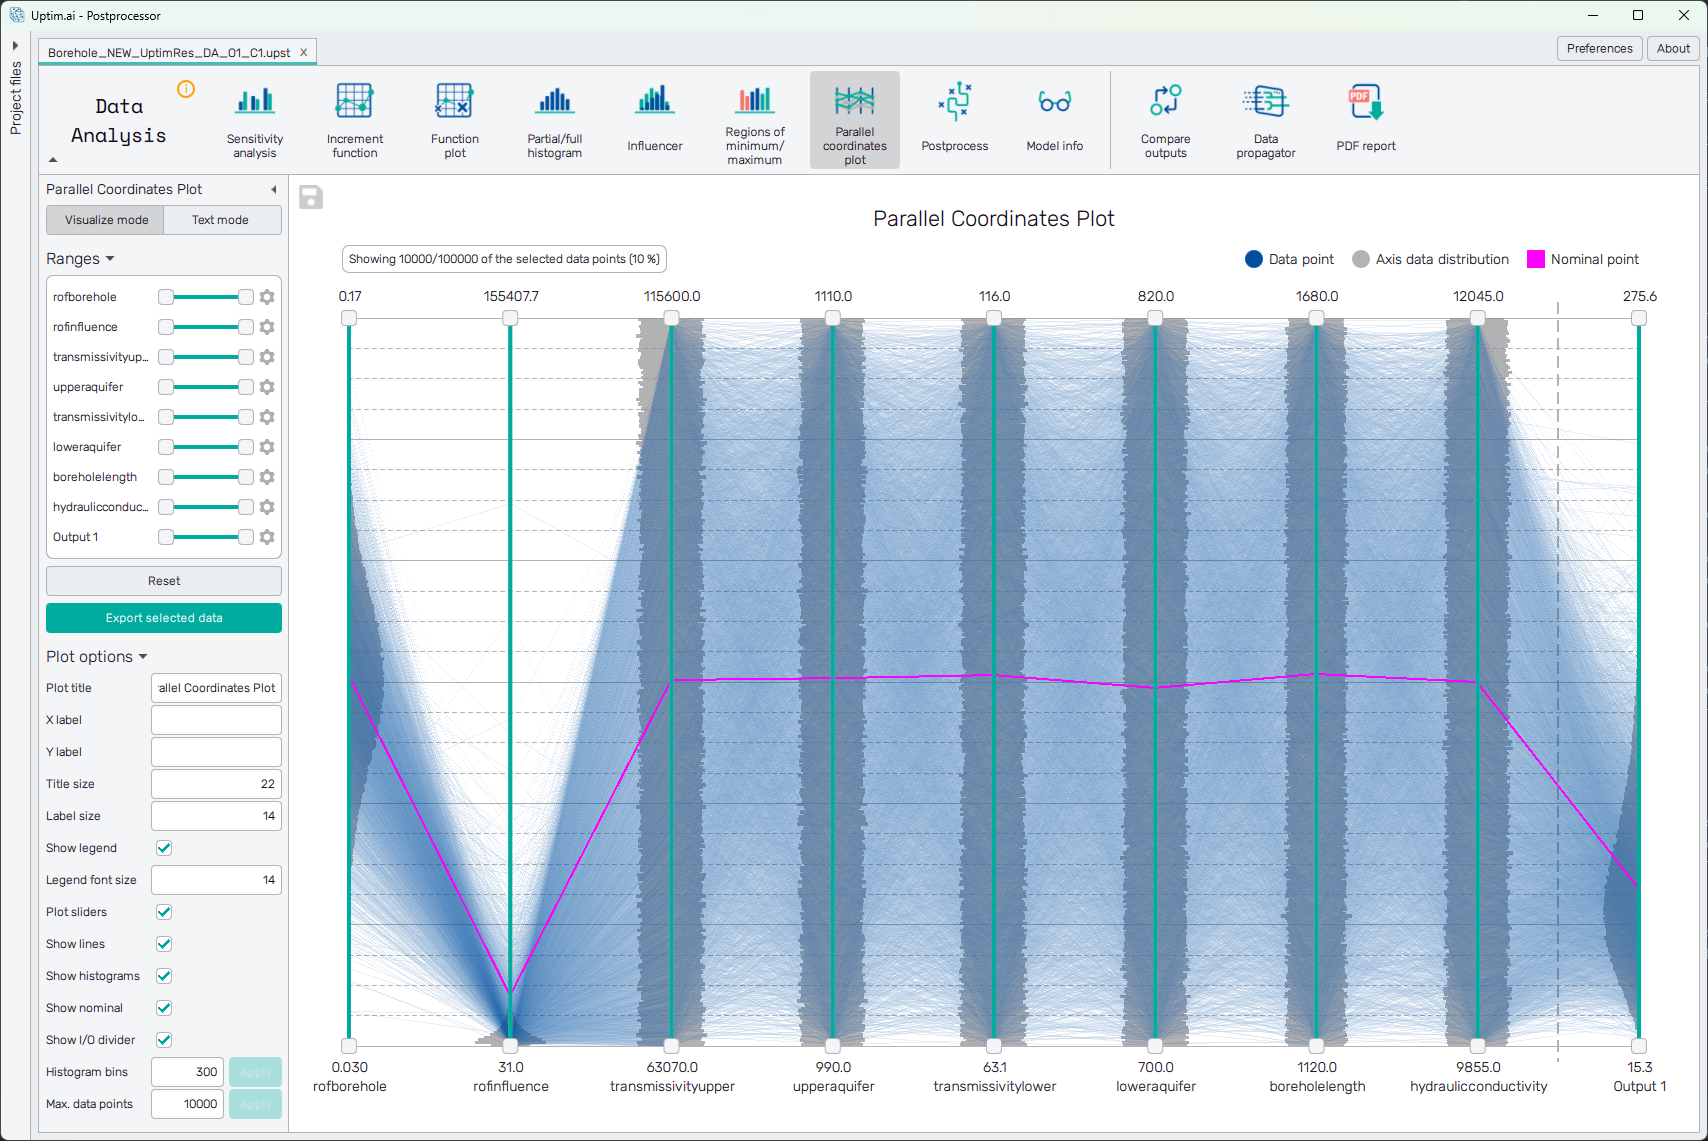
The Parallel Coordinates Plot is a visualization for exploring high-dimensional datasets. Each input or output variable is represented by its own vertical axis, and each design point (sample) is drawn as a polyline intersecting all axes at its respective values. In addition, each axis distribution is visualized using a histogram. In case of the Result file (.upst), the visualized points are the Monte-Carlo samples from the data file, propagated through the model.
This visualization is particularly useful for:
- identifying relationships and trade-offs between many variables at once,
- detecting clusters of similar designs,
- spotting outliers or constraint-violating points,
- comparing selected designs against the nominal point.
How to use the interface
The view is divided into two main areas:
-
Left side – Sidebar
Used for selecting variable ranges, adjusting plot options, switching views, and exporting data. -
Right side – Plot / Table view
Displays either the parallel coordinates plot or a tabular (text) view of the same data.
Sidebar controls
The user can switch between the Visualize mode and Text mode.
Range selection
In the upper part of the sidebar, users can define ranges for individual inputs and outputs. These ranges act as filters and immediately affect which points are shown in the plot.
The range sliders in the sidebar are fully synchronized with the sliders directly on the plot axes:
- adjusting a range in the sidebar updates the plot,
- adjusting a range on an axis updates the sidebar.
The Reset button restores all ranges to their default (full) domain.
The Export selected data button allows to save the selected data to a CSV file.
Plot options
- Plot title : Displayed above the plot.
- X label : Label of the X axis.
- Y label : Label of the Y axis.
- Title size : Size of the title font.
- Label size : Size of the label font.
- Show legend : Switching on/off the legend of the plot.
- Legend font size : Size of the legend font.
- Plot sliders : Switching on/off the sliders directly on the plot axes.
- Show lines : Switching on/off the polylines.
- Show histograms : Switching on/off the histograms rendered on the plot axes.
- Show nominal : Switching on/off the highlighted nominal point.
- Show I/O divider : Switching on/off the vertical dashed line separating the input variables and outputs.
- Histogram bins : Sets the number of bins for the axis histograms.
- Max. data points : Sets the maximum number of polylines drawn (selected randomly from the whole dataset). Setting this to a large number increases the rendering time.
Parallel coordinates plot
Polylines and histograms
In the plot view:
- each polyline represents one design point,
- each axis shows a distribution histogram, giving immediate insight into the data spread for that variable.
For performance reasons, the plot displays a limited number of polylines, randomly sampled from the selected dataset.
The maximum number of displayed points can be adjusted by the user to:
- increase detail (at the cost of rendering time), or
- improve responsiveness on slower machines.
Interactive range filtering
Each axis contains an interactive range slider:
- moving the slider filters points in real time,
- changes are mirrored in the sidebar controls.
This makes it easy to explore subsets of interest directly in the plot.
Nominal point and point selection
The nominal point is shown in magenta, allowing quick comparison against other designs.
Users can click on any polyline to select a specific point:
- the selected point is highlighted in red,
- a popup appears showing the exact values for all axes.
This makes detailed inspection of individual designs straightforward, even in dense plots.
Text (table) view
When switched to text view, the visualization is replaced by a sortable table containing:
- the same inputs and outputs,
- the same filtered subset of points,
- identical data to what would be exported to CSV.
This view is useful for precise numerical inspection or quick comparisons using column sorting.